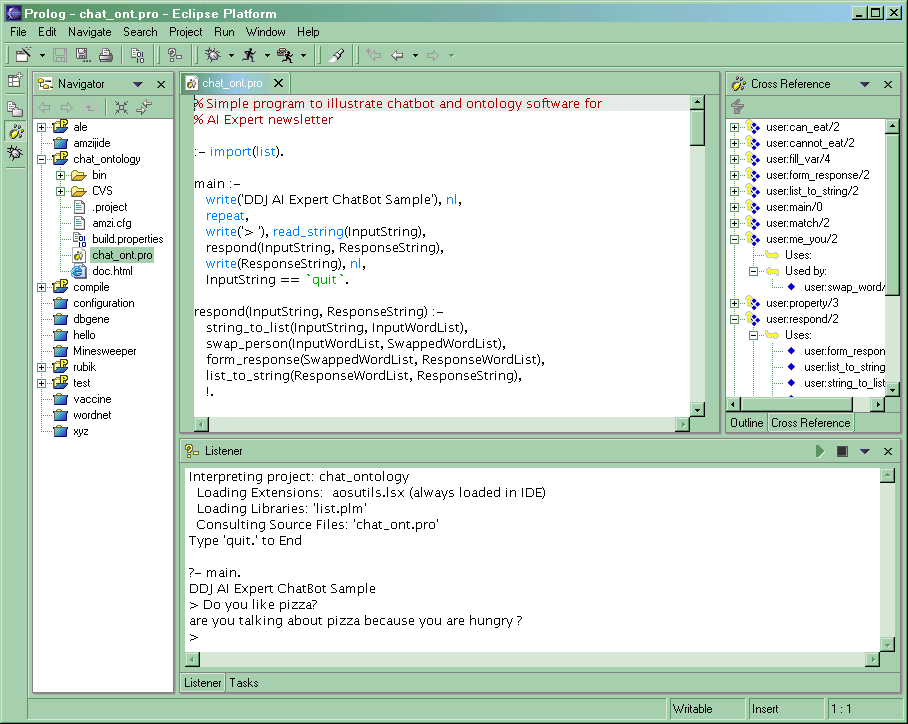
The IDE showing Prolog projects on the right, an editor window with syntax coloring in the center, the project cross reference on the right and an active Prolog listener at the bottom running the program.

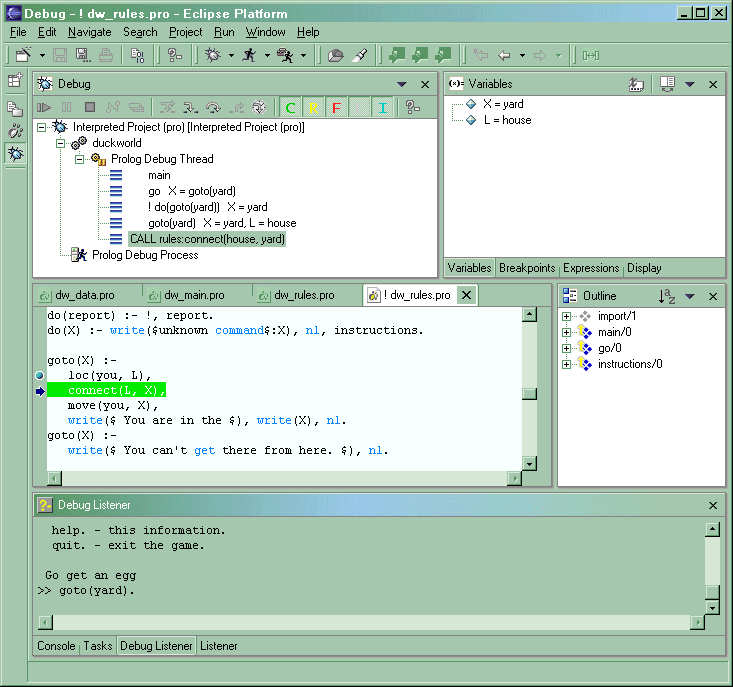
The IDE debugger showing the call stack in the upper left with its variable bindings in the upper right. In the middle left is the source code, the green highlight illustrates the debugger is performing a 'call' (as opposed to a fail, redo or exit). The middle right is an outline of the source code, and at the bottom is the debugging listener. It is dimmed because it is not waiting for user input at the moment shown.
